


We call our reporting function Insights, and it provides an interactive interface to analyze the key performance-metrics of your team.
With a focus on response times, and alarm and event statistics, Insights helps managers identify areas of their operation that can be improved. It can be used for general event statistics such as outcome frequencies, as well as more specific applications, such as identifying individual alarm points that consistently throw nuisance alarms.
Insights’ main menu groups reports into two main categories, ‘general’ and ‘specifics’. Users simply select the report they want to see and the interface immediately displays a dynamic graph of the data. To see the data in different ways, users can easily toggle the chart type (line-graph, bar, pie, table) as well as change the time frame of the data. For more detailed information, users can filter a range of field types and zero-in on the data that is most important.
Drill into a specific data point in a snap—simply click on the graph element and Insights will automatically open up a new graph displaying it.
Let’s look at a couple of very simple examples that demonstrate the power of Insights:
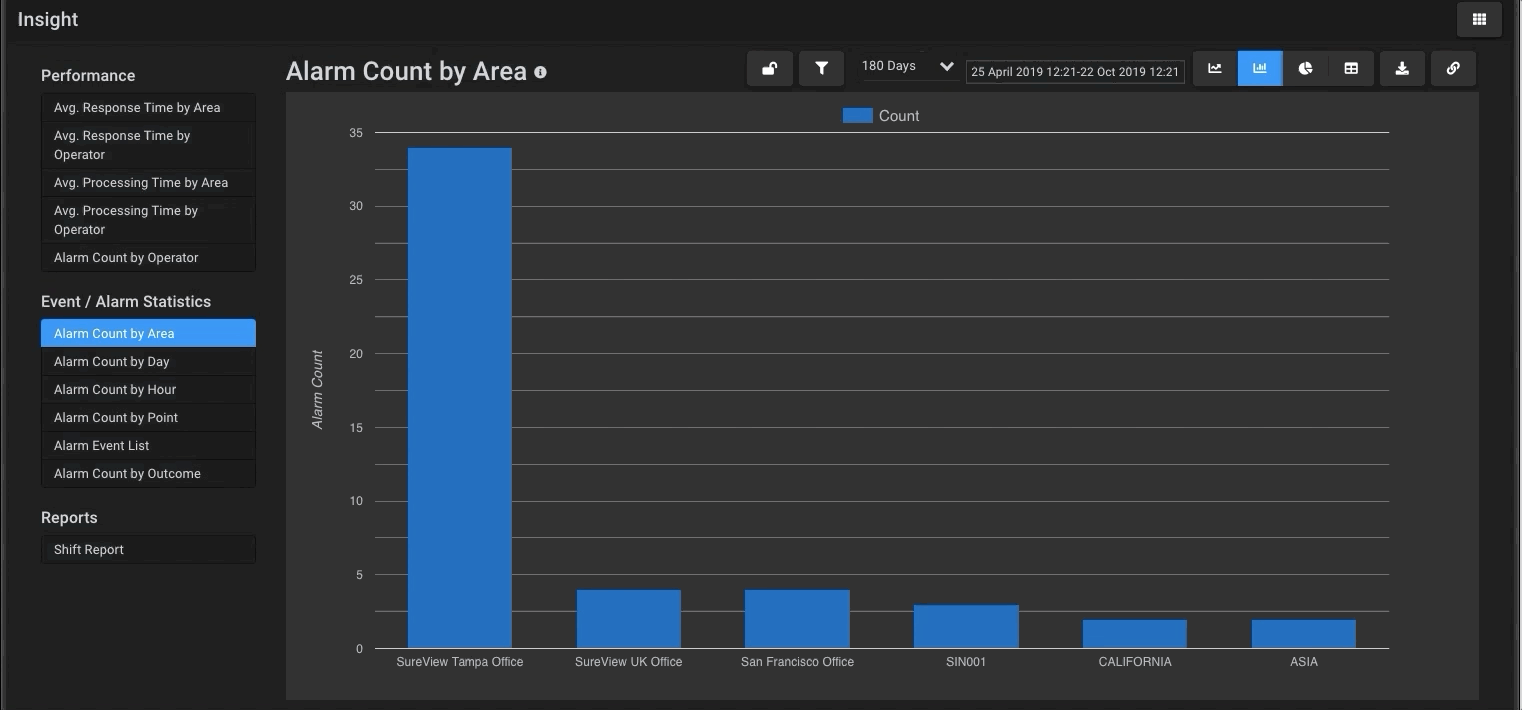
A Security Manager wants to quickly see a view displaying alarm traffic this month. To access this, they simply click on “alarm count by area” and notice that the 35 Queen St. building has triggered twice as many alarms as any other building this month. To find out why, they click on the 35 Queen St. bar and Insights shows a report of all alarms that occured in that building during the month. Immediately, it’s clear that there is one door that is creating an immense amount of traffic. This Insight report can share a link to this view with the local security manager. Now the local team can investigate to see if this is a device issue, or an operational issue, and take steps to address it.
The same manager wants to see the performance metrics of operators responding to events. He hopes to reduce response time to under 90-seconds. He opens the “avg. response time by operator” report and immediately sees that 2 members of his staff are taking a lot longer to respond to events than the average for the rest of his team. He can then drill into this to see the specific details of each event, helping him to determine if this was simply caused by the volume of traffic or perhaps a larger training issue.
To learn more or schedule a demo to see how SureView can simplify your security operation, click here: https://hubs.li/Q01gjjjx0

